Australian Toy Sales Rise 11%, Led by Building Sets and Collectibles
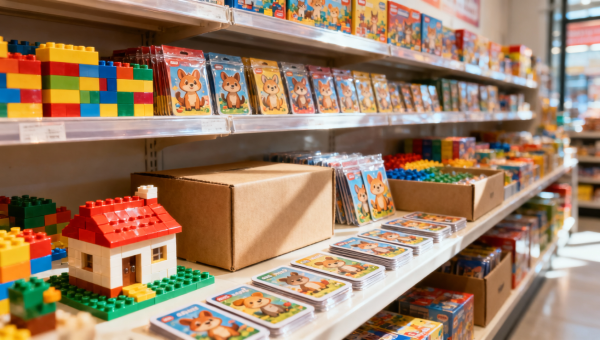
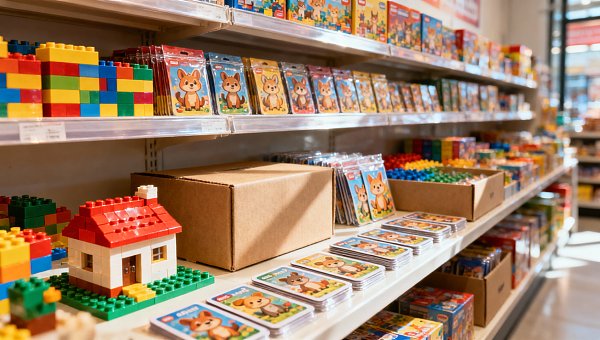
Australia’s toy market recorded an 11% year-on-year increase in sales value in the 12 months to October 25, 2026, according to market research firm Circana. Pokémon trading cards, building sets and collectibles were among the core categories driving the increase.
Sales value also rose 6% year on year across September and October, pointing to continued demand in the period before the Christmas shopping season. The figures show growth over both the full 12-month period and the more recent two-month window, although they do not establish how the market will perform during Christmas shopping itself.
What the two growth figures show
The 11% increase describes the change in sales value over a full year compared with the preceding year. The 6% figure measures a shorter period, September and October, against the same months a year earlier. Both are positive, but they cover different lengths of time and overlap within the reporting period.
Because the measures compare different periods, the gap between 11% and 6% should not be read on its own as proof of a particular month-by-month trend. The figures do not show how sales changed within the earlier part of the year, or whether growth in either September or October differed substantially from the combined two-month result.
They also measure sales value rather than the number of products sold. A rise in value can reflect changes in quantities, prices or the mix of products purchased. The reported figures do not separate those effects, so they do not establish how much of the increase came from more units being sold.
Why the leading categories matter
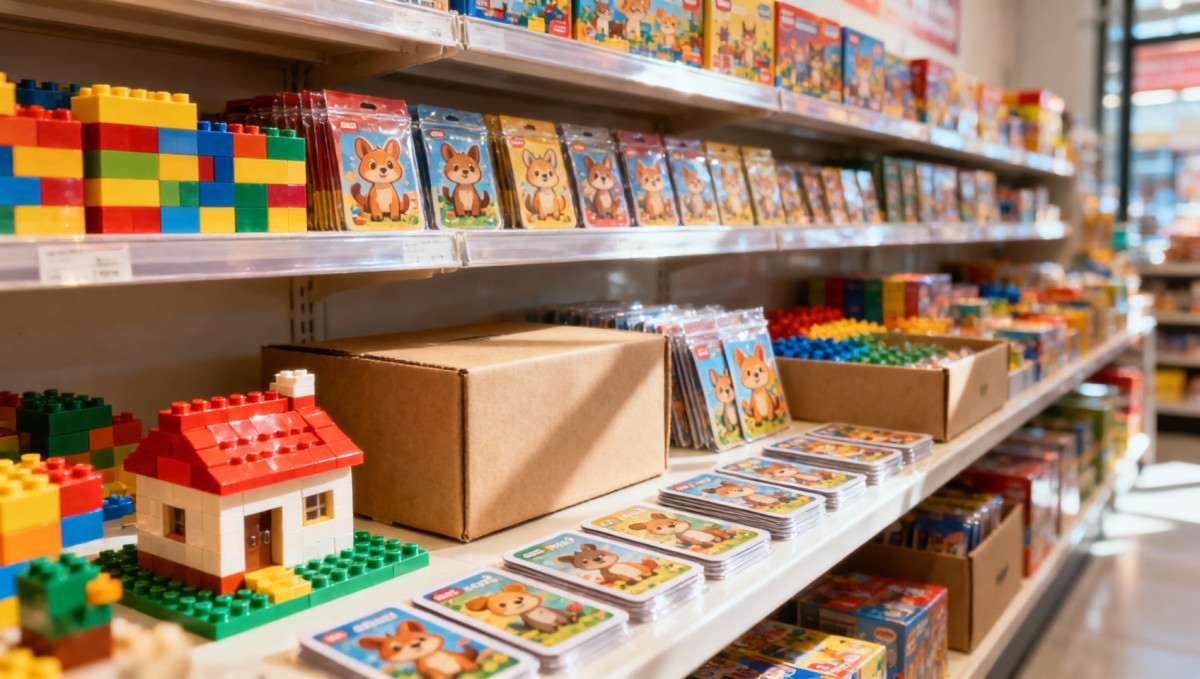
The identified growth drivers give the headline market result a more specific shape. Pokémon trading cards, building sets and collectibles helped push sales higher, making demand within those areas relevant to any assessment of the market’s recent performance.
That distinction matters for businesses planning their product ranges. An increase across the market does not mean that every toy category grew at the same rate, or that each of the named categories contributed equally. The reported information identifies the leading areas but does not provide their individual growth rates or shares of the increase.
For retailers and suppliers, the immediate question is therefore how demand for their own ranges compares with the broader pattern. A business focused on one of the named categories may have a more direct interest in whether recent demand continues, while a business with a different product mix would need category-specific evidence before drawing conclusions from the market-wide figure.
The categories themselves also cover different products and purchasing occasions. Their shared appearance among the growth drivers is useful evidence of where sales momentum was concentrated, but it does not establish that consumers bought them for the same reasons. Nor does the report quantify the contribution of Pokémon trading cards separately from other collectibles.
The Christmas shopping season is the next test
The September–October increase places the market on a positive footing ahead of Christmas shopping. It may influence decisions about product availability and the balance of ranges offered during the season, especially for businesses exposed to the categories identified by Circana.
Those decisions still depend on more than the overall growth rate. Demand can differ by product, and the annual figure does not indicate how quickly particular items sold or how much stock was available. For a supplier or retailer, the practical value of the market signal lies in comparing it with demand and availability across the products it handles.
The distinction between recent growth and the coming shopping period is equally important. Sales were higher in September and October than in the comparable months a year earlier, but that result does not guarantee the same rate of growth during Christmas shopping. The strength and distribution of demand over that period remain the key developments to watch.
Subsequent market updates could also clarify whether growth remains concentrated in trading cards, building sets and collectibles, or extends more broadly across toys. Category-level sales values and unit figures would help distinguish changes in the number of products sold from changes in the value of purchases.
For now, the clearest signal is that Australian toy sales grew over the reported year and continued to rise in the latest two-month period. The durability of that growth, and its implications for individual product ranges, will depend on how demand develops through the Christmas shopping season and beyond.
Related Intelligence
 STEM & Educational ToysNov 16, 2026Australian Toy Sales Rise 11%, Led by Building Sets and CollectiblesAustralian toy sales rose 11%, led by building sets, Pokémon cards and collectibles. Explore the trends shaping demand ahead of Christmas.
 Electronic & RC ToysNov 13, 2026Hong Kong Exports of Toys, Clothing and Other Traditional Goods Rise 14% in Q3Hong Kong exports of toys, clothing and other traditional goods rose 14% in Q3. Explore what the reported growth could mean for sourcing and delivery plans.
 Cosmetics & PkgNov 12, 2026Inner Mongolia Sheep Fat Completes Cosmetic Ingredient FilingInner Mongolia sheep fat has completed cosmetic ingredient filing. Explore the milestone, filing details, and key regulatory updates to watch.
 Cosmetics & PkgNov 11, 2026Cosmoprof Asia 2026 Focuses on Beauty Supply Chains and InnovationExplore Cosmoprof Asia 2026 in Hong Kong and discover beauty supply chain innovation, sustainable packaging, OEM and ODM services, and new sourcing opportunities.
 Cosmetics & PkgNov 10, 2026China Introduces Three-Tier Management for Special Cosmetics ChangesChina’s special cosmetics changes face a new three-tier management system from November 20, 2026. Discover what it means for applications and compliance.
 Cosmetics & PkgNov 09, 2026China Extends Suspension of 24% Additional Tariff on US Goods for Two MonthsChina extends its 24% additional tariff suspension on US goods for two months. See what the temporary relief means for trade and supply chain planning.
 Cosmetics & PkgNov 08, 2026EU Sets 25 ppb PFHxA Limit for Cosmetics, Challenging Supply ChainsEU PFHxA limits could reshape cosmetics supply chains. Explore the stated 25 ppb threshold, trace contamination risks and steps to prepare.
 Cosmetics & PkgNov 07, 20262026 Import Expo Hosts Global Beauty Innovation Forum in ShanghaiExplore how the 2026 Import Expo’s Global Beauty Innovation Forum in Shanghai could connect beauty businesses with cross-border sourcing and market opportunities.
 Skincare OEMNov 06, 2026China Consults on Cosmetic Ingredient Data and Safety AssessmentChina's cosmetic ingredient data and safety assessment consultation could affect formulation and compliance. Explore the draft guidance and its potential impact.
 STEM & Educational ToysNov 05, 2026Taiwan Squishy Toy Checks Find Safety Compliance but Labeling ViolationsTaiwan squishy toy checks found all 20 samples met safety requirements, but uncovered inspection mark and labeling violations. Discover what sellers need to know.
 Smart Pet DevicesNov 04, 2026Smart Pet Products Drive Export Growth as 140th Canton Fair Draws BuyersSmart pet products drew global buyers at the 140th Canton Fair. Explore export growth, lightweight cat litter and key sourcing considerations.
 Cosmetics & PkgNov 03, 2026Patchwork of US EPR Policies Drives Packaging RedesignUS EPR policies are reshaping packaging design. Explore how fragmented state rules could affect compliance, materials and supply chain decisions.
 Cosmetics & PkgNov 02, 2026Amazon US Insurance Rule Takes Effect Nov. 2, Mandating Coverage for 11 High-Risk CategoriesAmazon US insurance rule takes effect November 2, 2026. Discover coverage requirements for 11 high-risk categories and steps sellers can take to prepare.